Aggregate your indicators to see the bigger picture
Combine the results of indicators from multiple projects in one place to track the overall impact of your interventions
How can organisations investing in a range of different projects across multiple sites and categories measure their overall performance and impact?
Our indicator aggregation feature will help you go beyond individual project tracking to see the bigger picture. See how your key initiatives are performing on a local, national or global level, or combine results thematically or by donors to get a more comprehensive understanding of your operations.
When you add a new indicator to your project on TolaData, you have the option to make it an aggregating indicator, which means that this particular indicator will combine results in real-time from other contributing indicators that you link to it from within that project or from other projects so you can see your overall results in real-time and get a sense of how close or far your portfolio of activities is towards accomplishing your goals.
Group projects together
Tie relevant projects together by theme, focus area, donors, partners, regions or any other classification relevant to your organisation. This makes it easier to filter your list when searching for a specific project or to create hierarchies and custom program structures in line with how your organisation manages activities.

Control data sharing across multiple projects
You have full control over how your project data is used for aggregation across multiple projects. Only when a contributing project’s data has been shared, can the users of other projects link the indicators for aggregation.
Bring your results together
The aggregating indicators help you to combine the results of all contributing indicators. Just link the contributing indicators to the aggregation indicator and set the formula based on how you want the results combined and see your overall result in real-time. Your combined result is updated as the results from contributing indicators change.


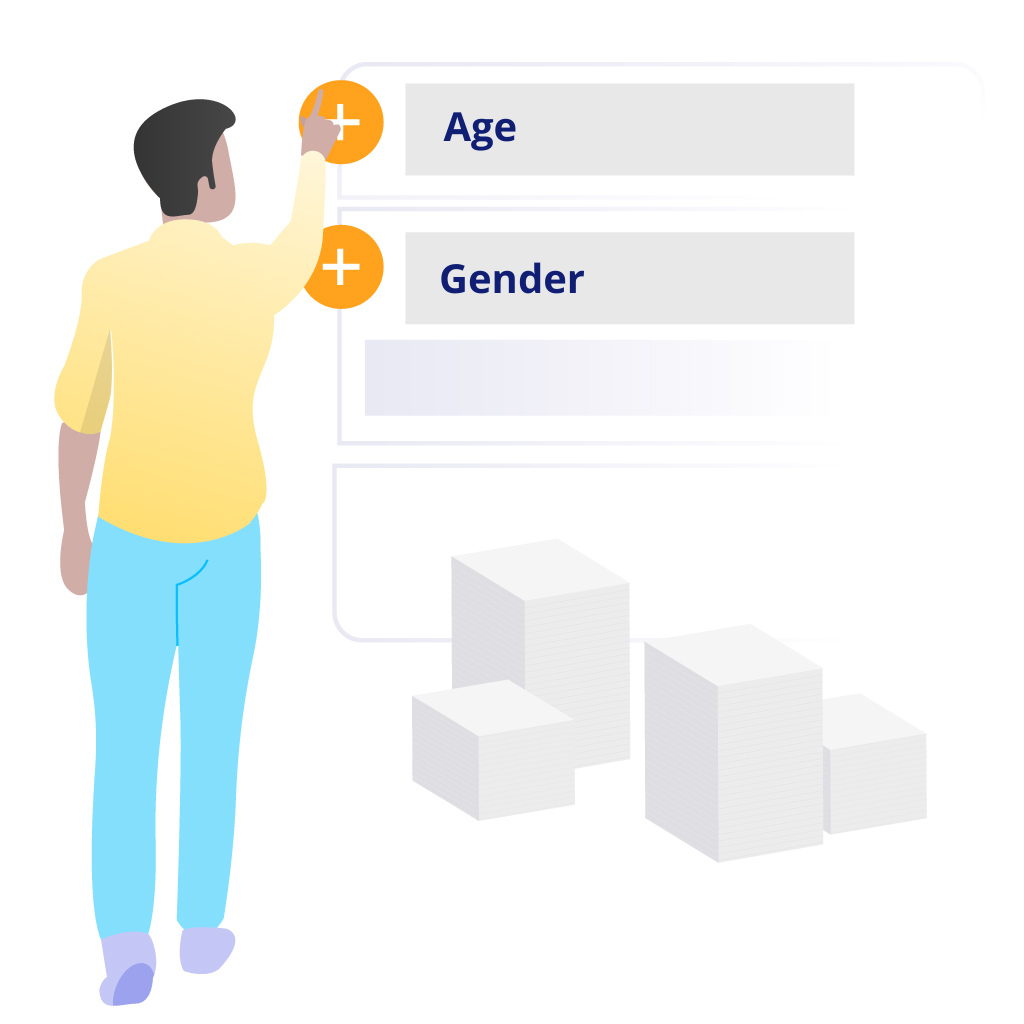
Aggregate your disaggregated data results
Analyse your aggregate results based on the disaggregation types used by your organisation or the disaggregation types that have been used on the contributing indicators. The combined results you see reflect your overall impact and are ready for reporting.
From tracking multiple projects to delivering greater impacts
Our indicator aggregation feature is an effective tool for your organisation to track and monitor the real-time progress of multiple interventions in one place. They take out the hassle of having to repeatedly aggregate your data in different ways to get the analyses you require for the variety of objectives you have to report against.
Aggregating your indicators help you stay focused on your goals and objectives, address issues and risks as they arise, allocate resources effectively, and leverage the full potential of your interventions to create the meaningful impact your organisation has set out to achieve. Share findings from your impact measurement with colleagues, donors and stakeholders to foster collaboration and learning while ensuring transparency and accountability at all times.


